Loading video…
The bar chart illustrates changes in commuting habits among U.S. residents between 2019 and 2025. Summarize the information by selecting and reporting the main features, and make comparisons where relevant.
Model Answer
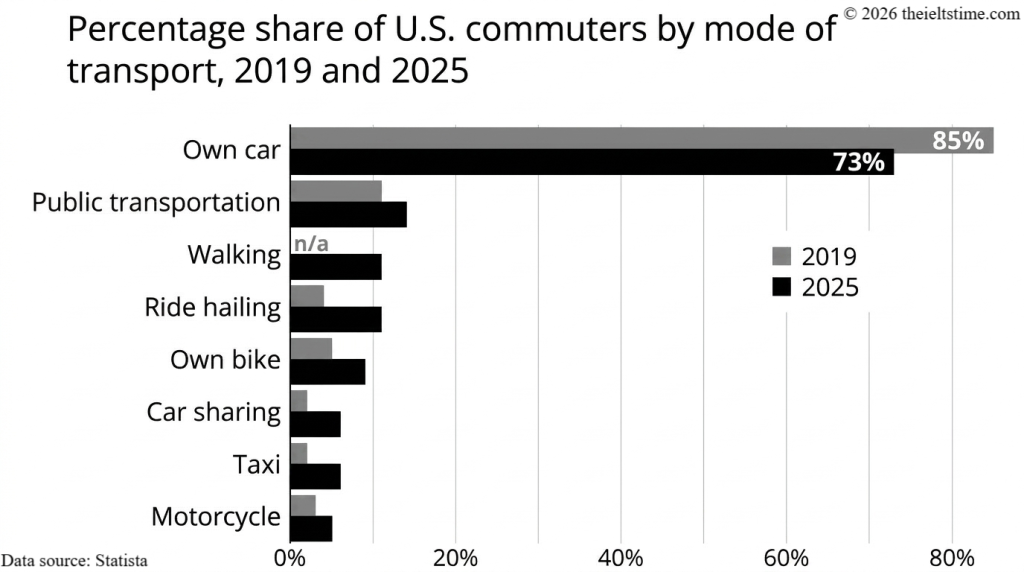
The bar chart compares the commuting preferences of U.S. residents in 2019 and 2025 across a range of transport modes.
Overall, while travelling by private car remained the most common choice, its dominance declined noticeably. By contrast, all comparable alternative modes increased in popularity, resulting in more diverse commuting patterns by 2025.
In 2019, private cars were by far the most widely used mode of transport, accounting for 85% of commuters. However, this figure fell significantly to 73% in 2025. In contrast, the proportion of people using public transportation rose from approximately 11% in 2019 to around 14% in 2025, indicating a gradual shift toward shared transport options.
Several other modes also experienced notable growth. The share of ride-hailing increased markedly from around 4% in 2019 to approximately 11% in 2025, while cycling rose from about 5% to roughly 9%. Walking, which had no available data in 2019, accounted for around 11% of commuters in 2025. Meanwhile, the least common modes—car-sharing and taxis—both grew from roughly 2% to about 6%, and motorcycle use saw a modest increase from approximately 3% to around 5%.
Leave a Reply