Loading video…
The bar chart and pie chart below provide information about the daily volume of oil production and the proportional share of the global total for the top five producing nations in 2024. Summarize the information by selecting and reporting the main features, and make comparisons where relevant.
Model Answer
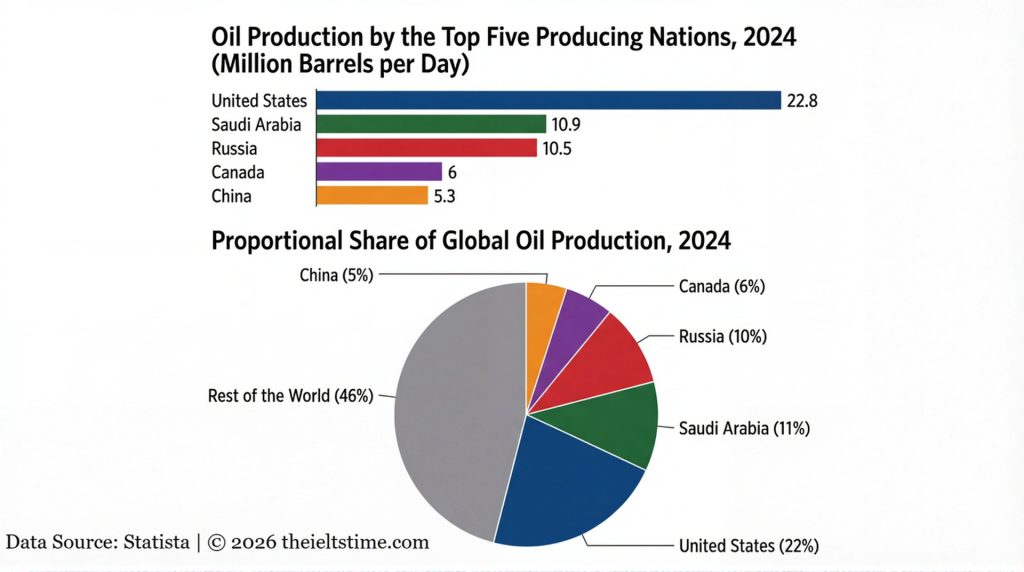
The bar chart and pie chart illustrate global oil production in 2024, comparing the daily output of five leading nations in millions of barrels and their respective shares of the total market.
Overall, it is clear that the United States was the world’s dominant oil producer by a significant margin in 2024. Furthermore, while the top five nations accounted for over half of all global production, a substantial portion of the world’s oil was still provided by other countries.
In terms of volume, the United States yielded 22.8 million barrels per day, which was more than double the output of the second-largest producer, Saudi Arabia, at 10.9 million. Russia followed closely in third place, producing 10.5 million barrels daily. There was then a noticeable drop in volume; Canada produced around 6 million barrels per day, while China’s output was slightly lower at 5.3 million.
Looking at the proportional distribution, the United States represented just over a fifth of the global total. Although these five nations were the primary contributors, the remaining 46% of global oil production was supplied by the rest of the world.
Leave a Reply